



Quick Summary
Tableau Pulse helps organizations move from static dashboards to continuous, AI-driven insight delivery by monitoring key business metrics in real time, detecting anomalies, and explaining changes in natural language. Across banking, retail, and healthcare, it enables faster decisions, reduces dependency on analysts, and improves KPI visibility by delivering contextual insights directly into daily workflows. Companies using AI-driven analytics tools report up to 30–40% faster decision-making cycles and improved data adoption across business users (Source: McKinsey)
Organizations are drowning in dashboards but starving for timely, actionable insights. Tableau Pulse Use Cases show how AI-driven, metric-centric analytics can finally close this gap for business teams that do not live in BI tools all day. Instead of waiting for monthly reports or chasing analysts, leaders in banking, retail, and healthcare can get proactive, natural-language insights of what changed, why it changed, and what actions to take.
Traditional BI is still essential for deep analysis, but it often fails real-time decision support for front-line managers and executives. Tableau Pulse changes this by continuously monitoring trusted metrics, automatically detecting anomalies, and explaining what changed, why it changed, and where to act next.
In this blog, you will explore practical Tableau Pulse use cases by industry, see concrete Tableau Pulse examples which shifted analytics from dashboard exploration to insight delivery.
Evaluate where your teams still rely on manual reporting - those are your first opportunities.
Talk to our expertsWhat is Tableau Pulse?
Tableau Pulse is an AI-powered insights experience that continuously tracks business metrics and delivers explanations, trends, and alerts in natural language. It is designed for business users who need answers quickly without deep interaction with BI tools.
Unlike traditional dashboards that require manual exploration, Tableau Pulse operates in the background, monitoring, analyzing, and informing.
Why does this matter? Because most business users do not have time to interpret dashboards daily.
How Does Tableau Pulse Work in Practice?
To understand its value, it is important to look at how Tableau Pulse functions within an enterprise data analytics environment.
Core workflow
Before insights can be delivered, organizations must define and govern their metrics properly. Tableau Pulse builds on this foundation.
- Define trusted metrics in the Metrics Layer so all teams work from a single source of truth.
- Connect these metrics to governed data in Tableau Cloud and embed business context (owner, definitions, thresholds).
- Tableau Pulse is observing continuously the performance of metrics in terms of time and dimensions.
- AI detects trends, anomalies, and key drivers, then generates natural-language insight summaries.
- With Slack, email, Tableau Mobile, Microsoft Teams, and embedded experiences, insights are provided in the course of work.
- Business users drill down, enquire with follow-up questions in a natural language, and provide insights to trigger action.

What Are the Key Capabilities of Tableau Pulse?
Tableau Pulse combines several capabilities that make it practical for business use—not just technical analysis. These features reduce the time between data change → insight → action.
- Automated detection of trends, drivers, and anomalies for followed metrics.
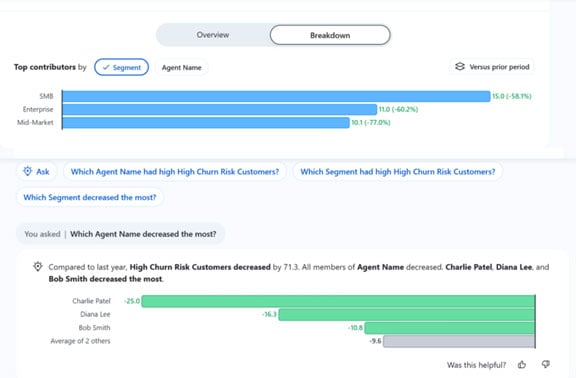
- Explanations that use natural-language and explain what and why change and these that link into further exploration.
- Personalized metric digests and alerts based on users’ roles and subscriptions.
- Collaboration integration means that insights can be shared directly with Slack, Teams, email, or Salesforce.
- Real‑time KPI monitoring with contextual insights
Why Are Organizations Adopting Tableau Pulse?
Adoption is driven by clear business outcomes rather than technical features. Here are some of the key advantages:
- Faster decision-making: Leaders do not operate on old monthly reports, they have fresh new analytics.
- Reduced dashboard dependency: Non technical users receive answers without having to construct and navigate complicated views.
- Higher analytics adoption: Front-line workers use plain-language insights rather than threatening BI applications.
- Early warning of risks and opportunities: Automated detection of anomalies and trends.
- Shared, trusted metrics: Everyone works from the same definitions, reducing conflicting numbers in meetings.
According to Gartner, organizations that adopt augmented analytics tools see up to 50% improvement in decision speed.
Tableau Pulse Use Cases in Banking and Financial Services
Banking and financial services work on a thin margin and high risk basis where quick and reliable decisions are of primary importance to the bank. Tableau Pulse applications in this case revolve around day-in day out monitoring of financial performance, risk, and customer behavior.
Tableau Pulse Examples – Banking
1. Daily loan portfolio health monitoring
Risk and lending teams define metrics such as Non-Performing Loans (NPL) rate, approval rate, and average time to decision, segmented by product and region. Tableau Pulse constantly tracks such measures and raises red flags when there is an anomaly in the delinquency or approval refuses, with natural-language explanations showing the segments, branches, or products that caused the shift.
Business impact:
- Early identification of the developing credit risk within a particular portfolio.
- Quick policies/pricing changes to defend the margins.
- Less unexpected risks during monthly or quarterly risks reviews.
2. Fraud and anomaly detection alerts
Transaction monitoring teams track measures that pertain to suspicious transactions, volumes of dispute, and chargebacks. Tableau Pulse detects unusual patterns—such as a sudden uptick in high-value disputes tied to a specific merchant category or region—and sends alerts with contextual drivers.
Business impact:
- Faster investigation cycles and reduced fraud losses.
- Data-backed conversations between risk, operations, and product owners.
3. Branch and channel performance monitoring
The retail banking leaders monitor such indicators as the number of new accounts opened, cross-sell ratio, and net revenue per branch. Tableau Pulse identifies those branches which trend above or below the target and clarifies what products, customer groups or campaigns drive the shift.
Business impact:
- Targeted coaching for underperforming branches.
- Replication of tactics from top-performing locations.
Tableau Pulse Use Cases in Retail and E‑Commerce
Retail and e-commerce face constant volatility in customer behavior, demand, and supply chain dynamics. Tableau Pulse use cases here emphasize sales performance, inventory health, and conversion behavior.
Tableau Pulse Examples – Retail
1. Regional and product-level sales monitoring
Merchandising and commercial leaders follow metrics like Net Sales, Units Sold, and Margin by category and region. Tableau Pulse sends daily or weekly digests summarizing where sales are beating or missing plan and why—highlighting the specific categories, price points, or channels contributing to the change.
Business impact:
- Faster assortment and pricing decisions.
- Data-driven conversations between merchandising, marketing, and operations.
2. Inventory health and stockout prevention
Supply chain teams define metrics such as Stockout Rate, Days of Supply, and Inventory Turn by location and product family. Tableau Pulse detects when stockout risk increases or inventory sits too long in specific locations, then surfaces the SKUs and stores driving the issue.
Business impact:
- Reduced lost sales due to stockouts.
- Lower working capital tied up in slow-moving inventory.
3. Promotion effectiveness and conversion trends
Marketing and e-commerce teams monitor metrics like Promotion Lift, Conversion Rate, Cart Abandonment Rate, and Customer Lifetime Value. Tableau Pulse explains which campaigns, channels, or customer segments are driving uplift or underperformance and flags outliers such as unusually high returns or low repeat purchase rates after a campaign.
Business impact:
- Real-time optimization of promotions and media spend.
- Better alignment between marketing, merchandising, and finance on ROI.
Tableau Pulse Use Cases in Healthcare
Healthcare organizations must balance clinical outcomes, operational efficiency, and patient experience. Tableau Pulse use cases in healthcare focus on patient flow, capacity management, and treatment outcomes.
Tableau Pulse Examples – Healthcare
1. Patient volume and wait time monitoring
Operations leaders and nurse managers follow metrics like ED Wait Time, Patient Intake Volume, and Staff-to-Patient Ratios. Tableau Pulse alerts them when wait times spike beyond thresholds and correlates this with factors such as time of day, staffing levels, or surge in specific case types.
Business impact:
- Quickly adjusting the staff and shifting resources.
- Less waiting time for patients and improved satisfaction.
2. Capacity and bed utilization insights
The hospital management monitors bed Occupancy rate, ICU utilization and Operating room utilization. Tableau Pulse reveals trends like unit occupancy which remain high and gives the ability to drill down to specific diagnosis-related group, physician, and referral source.
Business impact:
- Elective procedure scheduling and better capacity planning.
- Enhanced inter-unit/facility coordination.
3. Treatment outcomes and quality monitoring
The metrics tracked in clinical leadership include the Readmission Rate, Complication Rate and Patient Satisfaction Scores by the service lines and regions. Tableau pulse automatically creates summaries on areas where results are improving or getting worse and the cohort most affected.
- Earlier identification of quality issues or best practices.
- Stronger evidence base for clinical and operational improvement programs.
How Is Tableau Pulse Different from Traditional Dashboards?
Although the dashboards are still at the core of the exploratory analytics, Tableau Pulse alters the way business users use insights in their day-to-day life.
| Capability | Traditional Dashboards | Tableau Pulse |
|---|---|---|
| Analysis approach | Manual exploration | Automated insight delivery |
| Monitoring | Periodic | Continuous |
| Explanation | Requires analysts | AI explanations |
| Alerts | Limited | Proactive |
| Adoption | Analyst-centric | Business user friendly |
Why Should Enterprises Consider Tableau Pulse Now?
The above applications of Tableau Pulse in banking, retail, and healthcare show that AI-based, metric-focused analytics might finally bridge the data to decision divide. Tableau Pulse enables companies to take action in real-time and with great accuracy by constantly tracking trusted KPIs, interpreting variations in natural language, and providing insights directly into applications like Slack, Teams, and Salesforce.
Trying to address credit risk, optimize promotions, or even lower ED wait times Tableau Pulse use cases and examples can unlock considerable value with what data investments you have made already. Here are the key takeaways:
- Tableau Pulse transforms the KPIs into conversational AI-driven insights provided in the flow of work.
- It continuously monitors KPIs and explains changes automatically
- Enterprises gain faster decision cycles and broader data adoption
- Tableau Pulse implementation requires a robust data management, refined metrics and careful execution
If your teams are still waiting for reports, the problem is not data—it is delivery
Talk to our expertsFAQs
Dashboards and Tableau Pulse differ in that the former is a manual search of the user and the latter is the insights being presented to the user. It interprets changes in metrics, points out drivers, and notifies users automatically, which minimizes the use of analysts.
It is not a complete replacement of dashboards but a supplement. Dashboards are useful in deep analysis and Tableau Pulse is helpful in continuing monitoring and proactive insights.
Organizations require governed, time series measures, explicit Metrics Layer, and business/finance alignment with KPI definitions. Further evaluate data preparation, build Tableau Pulse applications, and execute integrations to push insights into daily tools.
Tableau Pulse is aimed at delivering proactive insights and this is achieved through constantly checking metrics and pushing out explanations. ThoughtSpot is more of search-driven data analytics, in which the user can ask questions and interactively explore the data in the process.
Pulse AI is used to analyze KPI changes, identify drivers behind performance shifts, detect anomalies, and generate natural-language explanations that help users understand what happened and what actions to take.
Yes, Tableau Pulse may be utilized by the viewers who have access to the metrics. Pulse aims at business users and can enable even non-technical viewers to obtain insights, alerts, and explanations without having to create dashboards.

