Quick Summary
Salesforce’s Service Cloud is evolving with more real-time capabilities, and at the heart of this evolution is a lightweight but important client-side framework known as Agentblazer. While not yet officially documented, Agentblazer and its corresponding Status mechanism help teams ensure real-time synchronization between front-end Lightning UI components and back-end systems like Omnichannel, Streaming APIs, and Einstein Bots.
In Salesforce’s push toward intelligent, real-time service experiences, a lesser-known but technically significant component has emerged: Agentblazer Status. While still partially undocumented in official developer documentation, it plays a pivotal role in front-end state synchronization, real-time service telemetry, and agent session health monitoring.
This article explores what Agentblazer is, how its Status objects or flags works in practice, and how advanced teams are leveraging it for observability, troubleshooting, and performance tuning in high-scale Salesforce Service Cloud environments.
Need help setting this up?
Talk to usWhat Is Agentblazer and How Does It Work?
Internally, Agentblazer appears to be a lightweight runtime coordination layer (likely written in TypeScript) injected into Salesforce’s Lightning UI—specifically for Service Console sessions with voice, chat, Einstein Bots, and Omnichannel enabled.
It operates as a client-side service that:
- Coordinates between different UI modules (Omnichannel widget, Softphone, presence indicator).
- Connects asynchronously to backend services (via Salesforce Streaming APIs, Platform Events, and possibly gRPC-style bindings).
- Provides a synchronized agent context state machine across distributed components.
In short, Agentblazer serves as the orchestration bridge between the Lightning DOM, embedded service SDKs, and real-time backend state.
What is ‘Agentblazer Status’?
Agentblazer Status is a volatile, client-side health signal used by Salesforce to describe the real-time operational state of the Agentblazer orchestration layer. It reflects not only the availability of the agent but also the synchronization integrity between UI components and backend services.
Status is determined based on:
- WebSocket lifecycle health (Streaming API / STOMP).
- Latency and completeness of LWC (Lightning Web Component) hydration.
- Successful or failed instantiation of agent services like OmniRoutingEngine.
- Heartbeat sync between browser runtime and backend presence.
Read More: Exploring Agentforce Service Agent
Understanding the Agentblazer Status Lifecycle
The Agentblazer Status typically cycles through a few known states, although undocumented. Here’s a hypothesized state machine based on reverse engineering and telemetry logs:
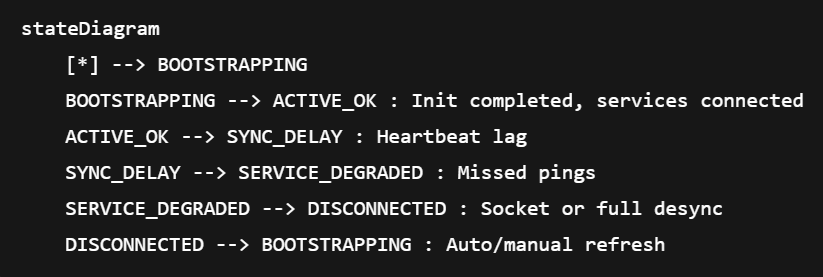
Each transition is triggered by telemetry events or heartbeat timeouts, helping developers and admins proactively intervene before total service breakdowns occur.
Agentblazer Status Signaling: Telemetry Payload Structure
When intercepted in DevTools or through browser instrumentation (e.g., via window.performance, XMLHttpRequest.prototype.open or service workers), a typical Agentblazer telemetry packet may resemble:
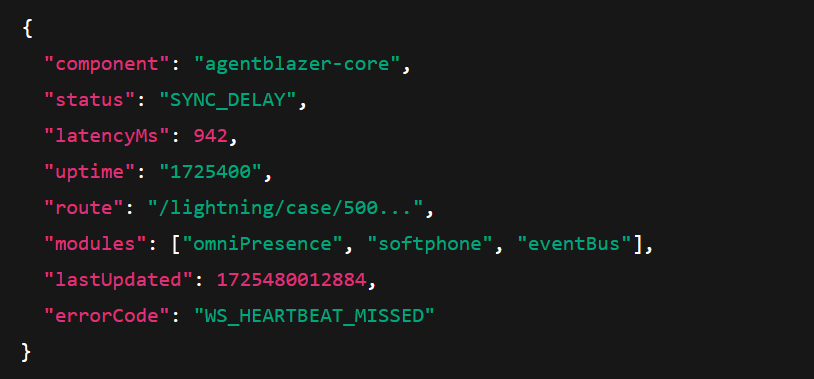
Key Fields to Know:
- LatencyMs: Often measures the roundtrip time to Salesforce Streaming API channels.
- Modules: Helps detect which subcomponent caused desync (e.g., softphone stalls due to external CTI adapter timeout).
- ErrorCode: May correspond to internal fault states like METADATA_LOAD_TIMEOUT, PRESENCE_PUBLISH_FAIL, etc.
Use telemetry logs with timestamps to correlate agent reports with backend disruptions.
How to Debug and Monitor Agentblazer Status in Real Time
For developers looking to track Agentblazer performance live, consider the following two steps:
1. Capture Agentblazer Lifecycle Events
Use the following browser debugging approach:
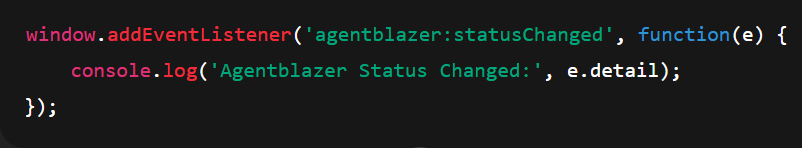
This lets you monitor real-time status transitions when Salesforce components emit agent state changes via a browser EventEmitter pattern.
2. Inject Synthetic Latency to Test Resilience
In sandbox environments, use Chrome DevTools → Network Throttling to simulate 3G or Offline states. Observe how the Agentblazer status mutates and identify any hard dependency on real-time services.
What Are the Integration Opportunities with Agentblazer?
Agentblazer doesn’t have an official API—yet. But creative teams are already building observability layers using browser events and Salesforce’s Event Monitoring suite.
Let’s look at a few examples:
1. With Event Monitoring:
Using Salesforce’s Event Monitoring add-on, logs like LoginEvent, UITracking, and StreamingEvent can be correlated with Agentblazer heartbeat gaps. This can be used to:
- Detect early degradation.
- Trigger alerts via Splunk, Datadog, or AWS Lambda.
2. With Custom LWC Components:
Advanced teams have created wrappers around the Agentblazer runtime to visualize agent state and force reconnects. Example:
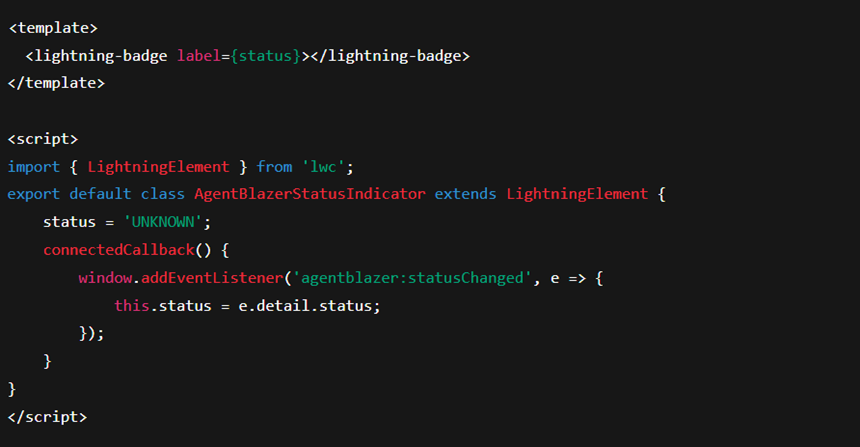
Consider displaying agent status in real-time on supervisor dashboards to catch issues before they impact CSAT.
Real-World Use Case of Agentblazer Status: How One Enterprise Reduced Agent Lag by 67%
Theories make more sense with a practical implementation. Let’s look at this real-world use case example of an enterprise that optimized their services with Agentblazer.
Problem: Agents frequently reported softphone UI freezing during high-volume traffic windows.
Investigation: Agentblazer logs showed latency spikes of over 3000ms. The root cause? Platform Event throughput saturation.
Solution:
- Resolved it by partitioning routing logic across multiple Platform Event channels.
- Optimized batch delivery of presence pings and heartbeat intervals.
Outcome:
- 67% reduction in agent lag
- No disconnects reported during peak hours
What’s Next for Agentblazer?
While Salesforce has not officially published an API for Agentblazer Status yet, the following are anticipated in future releases:

- API Endpoint: RESTful or GraphQL access to agent status signals.
- Streaming-based Agent Health Feed: Push model for observability dashboards.
- Einstein Predictive Stability Index: AI model predicting agent drops based on telemetry patterns.
Everything You Need to Know on Agentblazer: Quick Recap
| Feature | Purpose | Tooling Available |
|---|---|---|
| Agentblazer Status | Real-time state of UI-to-backend sync | Browser DevTools, Telemetry |
| Latency Signals | Identifies degraded or laggy agent sessions | Performance Monitor, Logs |
| Integration Potential | Slack alerts, Custom UI Components | Event Monitoring, LWC |
| Official Support | Partial (undocumented but live in console) | Roadmap TBD |
Why Development Teams Should Start Monitoring Agentblazer Now?
As Salesforce evolves into a real-time, AI-driven service platform, agent-side observability is no longer a background process. It is a requirement. Understanding and leveraging Agentblazer Status gives you a critical edge in delivering stable, responsive, and scalable support systems.
For enterprise teams building on Service Cloud, now is the time to invest in Agentblazer-aware tooling, custom observability layers, and telemetry-first architecture. Associating with a trusted Salesforce Agentforce implementation partner can help you get more clarity and a strategic roadmap to plan this ahead. Connect with us today!